Students Today
 Over 40 years of teaching experience, we have witnessed significant changes among students and their reactions to the principles course. The college pool has broadened from a relatively small, homogeneous group of prepared and motivated students to a much larger, academically diverse group including open enrollment students. Students have transitioned from using stand-alone print resources to screen interactions in a digital, networked, world of multimedia. These progressive social and technological changes have come with new challenges – student time scarcity from juggling employment and education, weaker literacy and numeracy skills, students questioning the relevance and value of increasingly expensive educational investments, and learning styles and attention spans conditioned to screen technologies.
Raised on social media, even the strongest students today tend to skim, not read. Microeconomics for Life is accessible to all potential principles of economics students, including those with weaker language and numeracy skills.
Enhancing Readability
The language and writing design follows the advice of The Economist Style Guide — Never use a long word when a small one will do; Never use a jargon word if you can think of an everyday English equivalent; Never use the passive where you can use the active. We use distinctive terminology to avoid confusion. Prices rise or fall. Quantities increase or decrease.
We make repeated use of characters in concrete consumer, business, and policymaker scenarios to personalize the narratives and resonate with student experiences. Examples include consumers making saving decisions; businesses making investment decisions, central bankers and politicians choosing monetary and fiscal policies. We model real-life decisions students can relate to.
Supporting Numeracy
Experienced principles instructors often see students who are less intimidated by a table of numbers than by a graph. All key graphs are developed from a simple table of numbers, so students can see the correspondence. There are faint background grids on graphs to make it easier for students to plot points and see connections between the numbers and graphs, without distracting from key curves.
Using Visuals
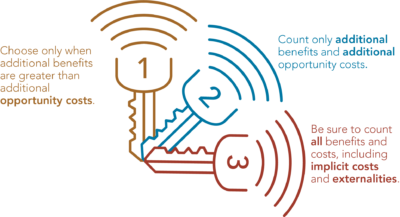
We repeatedly place a Hands-Off or Hands-On icon next to text where each positions is being explained. The icons serve as mnemonic devices to connect new material back to The Three Keys for Smart Choices (Micro) and The Fundamental Macroeconomic Question (Macro).
Using Video
For key analytical graphs, a short video plays when students click on the graph. In a voice-over, Professor Gordana Colby, an award-winning teacher, talks the student through the meaning of the figure, and trace shifts of curves and changes in outcomes. A moving cursor directs students’ attention to the portion of the figure being discussed in the narration.